Motivation and Definition
Although the goal of the HITRAN database[1] is to provide the user with line lists of fundamental spectral parameters for absorbing molecules in the gas state, we have encountered numerous cases where at the present time this is neither possible nor feasible. These cases include several situations: (1) important atmospheric molecules with significant infrared features in specific spectral regions for which there is not a sufficient amount of line parameters presently available, neither measured at high resolution nor theoretically calculated; (2) molecules with low fundamental vibrational modes of vibration which results in very dense spectra of overlapping bands; (3) molecules with severe resonances or other phenomena that have not been successfully modeled at present; and (4) UV transitions that have not been adequately analyzed at the level of line-by-line representation.
Case (1) is the primary category, especially concerning polyatomic molecules with many atoms, including the chlorofluorocarbons (CFCs) and other so-called "heavy" species. Even though for case (2) quite reliable line-by-line parameters for some bands may exist, many significant combination and difference bands may be missing. Examples of this case in HITRAN are chlorine nitrate (ClONO2), sulfur hexafluoride (SF6), and carbon tetrafluoride (CF4).
Early in the history of the HITRAN editions, it was decided to add a portion to the compilation called absorption cross-sections. These data are obtained from relatively high-resolution, high-quality, laboratory observations. The data in general have been measured at several temperatures and pressures. HITRAN casts them into a standardized format in order that they may be applied in a quasi-quantitative manner to radiative-transfer codes. The cross sections (cm2/molecule) can be incorporated directly into a line-by-line calculation as additive spectral values to the infinite resolution line absorption coefficients (with proper wavenumber interpolation), before the instrument function is applied. They are also very valuable in discriminating weak features in a user's spectra.
The absorption cross-section, $k_\nu$ (cm2/molecule), is defined as: \begin{equation} k_\nu = -\frac{\ln \tau_\nu}{\rho L}, \end{equation} where $\tau_\nu$ is the spectral transmittance at wavenumber $\nu$, temperature $T$ and pressure $P$, $\rho$ is the density (molecule/cm3) along an optical path of length $L$ (cm). In the HITRAN cross section data, $k_\nu$ is presented at several $(T, P)$ combinations representative of atmospheric layers given in commonly tabulated atmospheric models as well as conditions encountered in the polar regions.
It should be emphasized that the accuracy of the cross-sectional method is somewhat limited (especially for strong absorptions), and the data sets also do not allow extrapolation and interpolation to different thermodynamic conditions in the same way as line-by-line parameters. However, omitting the cross-sections in spectral regions where no line parameters are available can lead to much larger errors in the interpretation of line-by-line simulations of atmospheric spectra.
Structure and Formatting of Data
In the HITRAN FTP site, the data are presented as separate files for each individual molecule. Each portion of the file corresponding to a particular temperature-pressure pair begins with a header (see Table 1) that contains information on the wavenumber (cm-1) range, number of cross-section data in this set, temperature (K), and pressure (Torr). The maximum value of the absorption cross sections (cm2/molecule) and additional information containing the reference to that observation are also presented in each header. The cross sections have been cast into an equal wavenumber interval grid. It should be noted that the initial and final wavenumbers, $\nu_\mathrm{min}$ and $\nu_\mathrm{max}$, respectively, of each temperature–pressure set for a given wavenumber region are not always identical. They have been taken from the analysis of the observations. The sampling intervals are also not necessarily identical for each temperature–pressure set. The wavenumber interval of the grid is obtained by taking the difference of the initial and final wavenumber and dividing this quantity by the number of points, $N$, minus one, i.e., $\Delta\nu = (\nu_\mathrm{max} - \nu_\mathrm{min})/(N - 1)$.
This value of $N$ is provided so that a user’s personal program can read the table of cross- sections that follows the header. Note that the use of the features of HITRANonline makes much of this discussion transparent.
The table below illustrates the format of each header record. Following the header, the cross-section values are arranged in records containing ten values of fields of ten for each cross-section. In other words, each record contains 100 bytes (the trailing bytes on the last line may not be meaningful if $N$ is not a multiple of 10).
| Quantity | Field length | Type | Comment |
|---|---|---|---|
| Molecule | 20 | Character | Chemical formula (right-justified) |
| Minimum wavenumber, $\nu_\mathrm{min}$ | 10 | Real | Start of range (cm-1) |
| Maximum wavenumber, $\nu_\mathrm{max}$ | 10 | Real | End of range (cm-1) |
| Number of points, $N$ | 7 | Integer | Number of cross-sections in set |
| Temperature, $T$ | 7 | Real | Temperature (K) of set |
| Pressure, $P$ | 6 | Real | Pressure of set in Torr |
| Maximum cross-section value in set, $\sigma_\mathrm{max}$ | 10 | Real | Useful for scaling plots (cm2/molecule) |
| Instrument resolution | 5 | Real | See note |
| Common name | 15 | Character | Familiar name of molecule |
| Not currently used | 4 | Reserved for future use | |
| Broadener | 3 | Character | Air, N2, or self-broadened (if left blank) |
| Reference | 3 | Integer | Index pointing to source of data |
Note: Most cross sections have been taken from Fourier transform spectrometer (FTS) measurements. In that case the resolution is given in cm-1. There are some cross-sections taken from grating spectrometer measurements in the UV. In those cases, the resolution is given in milli-Ångströms in the form xxx mÅ, where xxx are up to three digits.
In the FTP site, for the IR cross-sections, the data on each molecule (chemical compound) are stored in separate files, which are labeled with the chemical symbol followed by an underscore and IRxx.xsc, where xx stands for the HITRAN edition that the data were originally introduced or later updated and the file extension xsc signifies that it is a list of cross-sections. For example, the file with the name C2H6_IR10.xsc contains ethane (C2H6) infrared cross-sections that were obtained in 2010.
It is to be noted that the files may have many temperature–pressure sets for different spectral regions, as indicated by headers throughout the file. While the temperature–pressure $(T, p)$ sets are reasonably complete for many species for an adequate simulation of atmospheric transmission in the spectral regions where those species are active, for other species an insufficiency of the $(T, p)$ sets may become apparent. It is hoped that future measurements at extended sets of $(T, p)$ combinations may help broaden the coverage in the database.
Several remarks should be made about the structure of the data:
- Occasionally data have been provided by contributors with some very small negative values of cross-sections. These values may be due to natural processes of the observation. In these cases, we have attempted to not only provide the data with all negative values zeroed out (to avoid non-physical calculations in some radiative-transfer codes), but have also repeated the files as originally submitted (these are placed in a subordinate folder with negative values kept and in a two-column format).
- When a provider has measured a large spectral region where there are significant non- absorbing gaps between bands, the HITRAN format may have removed null portions between bands in order to save file storage. In these cases, there will be more $(T, p)$ sets within a file; this is indicated by headers with different wavenumber regions within the file.
- Some UV cross-section data have been obtained from grating spectrometer observations rather than Fourier transform spectrometers. The original data have come on a wavelength grid rather than wavenumber. We have preserved these original sets in the subordinate folder, while casting them into the equal wavenumber grid in the main folder.
Use of Cross-sections using HITRANonline
HITRANonline provides a very convenient tool for downloading and plotting the cross- section data. A more detailed description of the features of HITRANonline is provided by Hill et al.[2]. We will give a specific example here.
The user wishing to employ the cross-section data, both infrared and ultraviolet, first goes to the pull-down menu under Data Access. One then clicks on the second entry, Absorption Cross Sections. A long table then appears which lists all the molecules that are currently available. For convenience, the user can search for the molecule by typing in either the common name or chemical formula, rather than scrolling down the list.
Let us choose the example of ethane (C2H6). Searching, or alternatively scrolling down and clicking on ethane, will highlight this molecule and also bring up a table on the right side of the screen showing all the currently available $(T, p)$ sets. In our example there are 14 such sets, all in the same wavenumber range (2545 to 3315 cm-1) and all with the same number of points in the set (613296). (In fact, this choice of molecule shows that all sets were taken at the same resolution and with the same broadener.) Running one's cursor over the table reveals the original source of the data.
For the sake of this example, we will choose four of the $(T, p)$ sets: (194.0, 103.9), (215, 119.2), (250.0, 200.1), and (270.0, 376.5). Having clicked on those boxes, we are now ready for step 2, Get data. One clicks on that box at the upper portion of the screen (notice that once the user has chosen at least one $(T, p)$ set, the box is highlighted in green and is ready for applying).
There may be a slight delay for the next page to appear, depending on the number of points involved. The next page shows a list of files of the four data sets chosen, and 2 files providing the reference data in different formats, followed by a rough plot of the 4 cross sections chosen. Clicking on any of the four data files (the first one is labeled C2H6_194.0_103.9_2545.0- 3315.0_13.xsc) brings up the full data file, exactly as it would appear in the HITRAN FTP site. One can then save it to one's local computer if desired.
The plot that appears is shown in Fig 1.
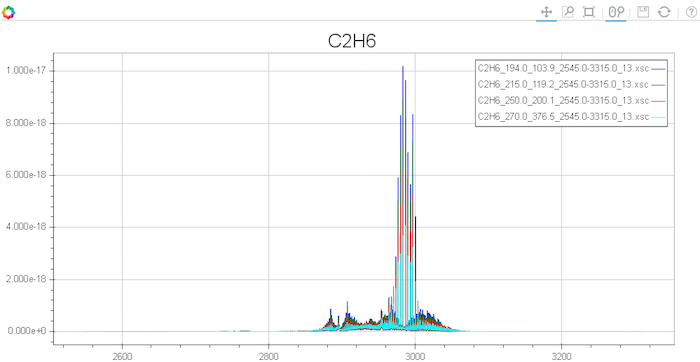
Figure 1. Plot of ethane cross-sections for four chosen temperature-pressure sets.
Just above the plot on the right side are some useful tools for viewing the plot in more detail. For example, clicking on the second symbol, ![]() Box Zoom, allows the user to go into the plot and expand a portion. If we use this to highlight the area around 3000 cm-1 and only cross sections between 0.0 and 2.0 × 10⁻¹⁸ cm2/molecule, we would obtain the following plot:
Box Zoom, allows the user to go into the plot and expand a portion. If we use this to highlight the area around 3000 cm-1 and only cross sections between 0.0 and 2.0 × 10⁻¹⁸ cm2/molecule, we would obtain the following plot:
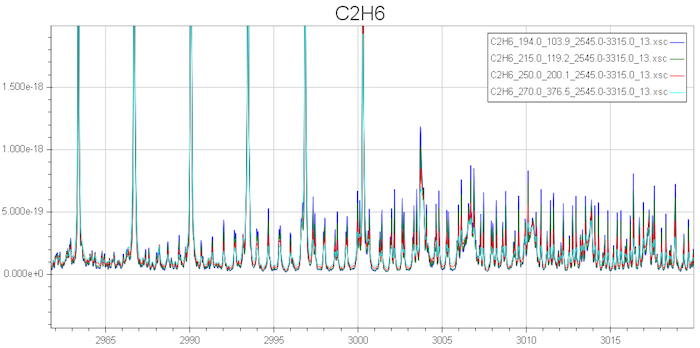
Figure 2. Zoomed-in portion of Fig. 1.
This zoomed-in plot can be further expanded. Figure 3 shows the portion between roughly 3005 and 3008 cm-1:
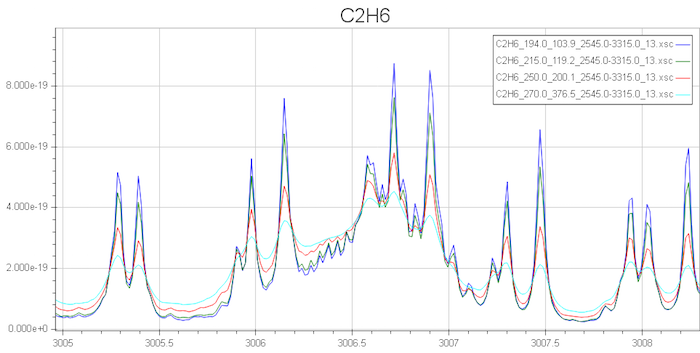
Figure 3. Further expansion of plot.
Note that at present we have limited the plot function to a maximum of 5 temperature-pressure sets; choosing more will only provide the data files and references.
Further information can be found in the most recent paper devoted to this section of the database [3].
References
[1] I. E. Gordon, et al., "The HITRAN2016 Molecular Spectroscopic Database", J. Quant. Spectrosc. Radiat. Transfer 203, 3-69 (2017).
[2] C. Hill et al., "HITRANonline: An online interface and the flexible representation of spectroscopic data in the HITRAN database", J. Quant. Spectrosc. Radiat. Transfer 177, 4-14 (2016).
[3] R. V. Kochanov et al., "Infrared absorption cross-sections in HITRAN2016 and beyond: Expansion for climate, environment, and atmospheric applications", J. Quant. Spectrosc. Radiat. Transfer 230, 172-221 (2019).